GUI Interfaces
GIFRÖST provides a graphical user interface for configuring, running, and monitoring replication flows. The dashboard address depends on the specific installation and environment configuration, so it is provided as part of the deployment.
The interface is the operator's central workspace. It supports source and target creation, parameter-based connector configuration, replication mode selection, live flow monitoring, on-demand initial loading, and operational automation through monitoring and action modules.
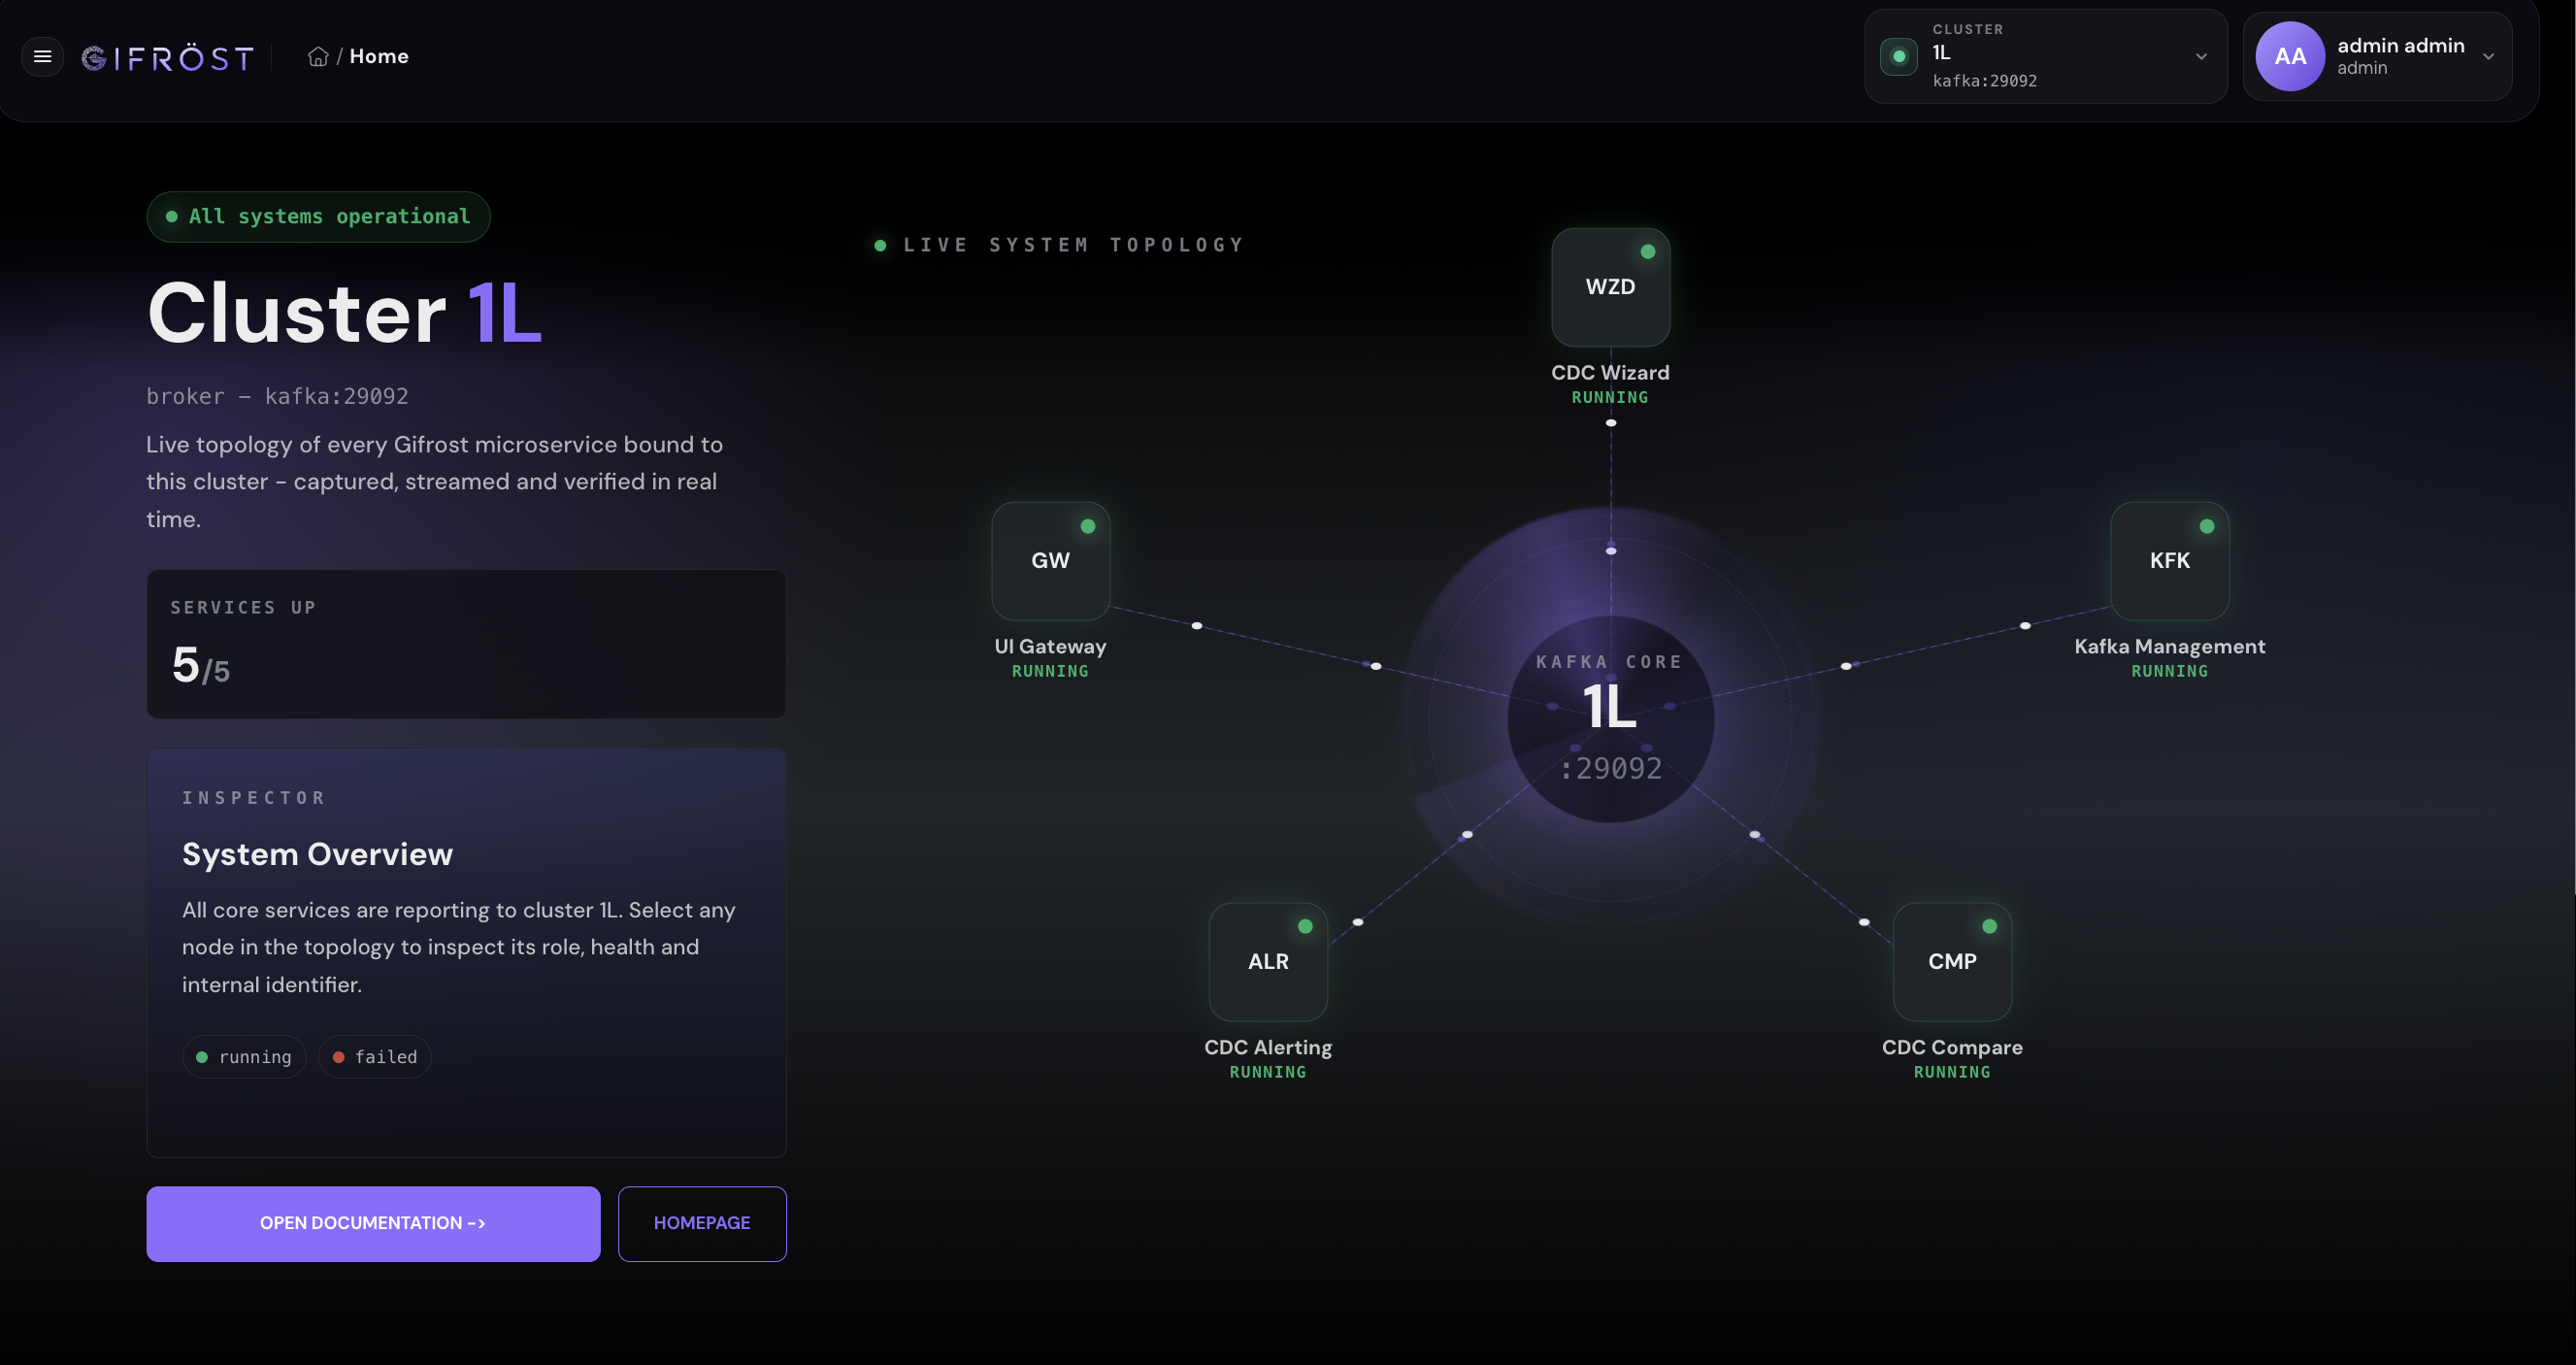
Operations Center
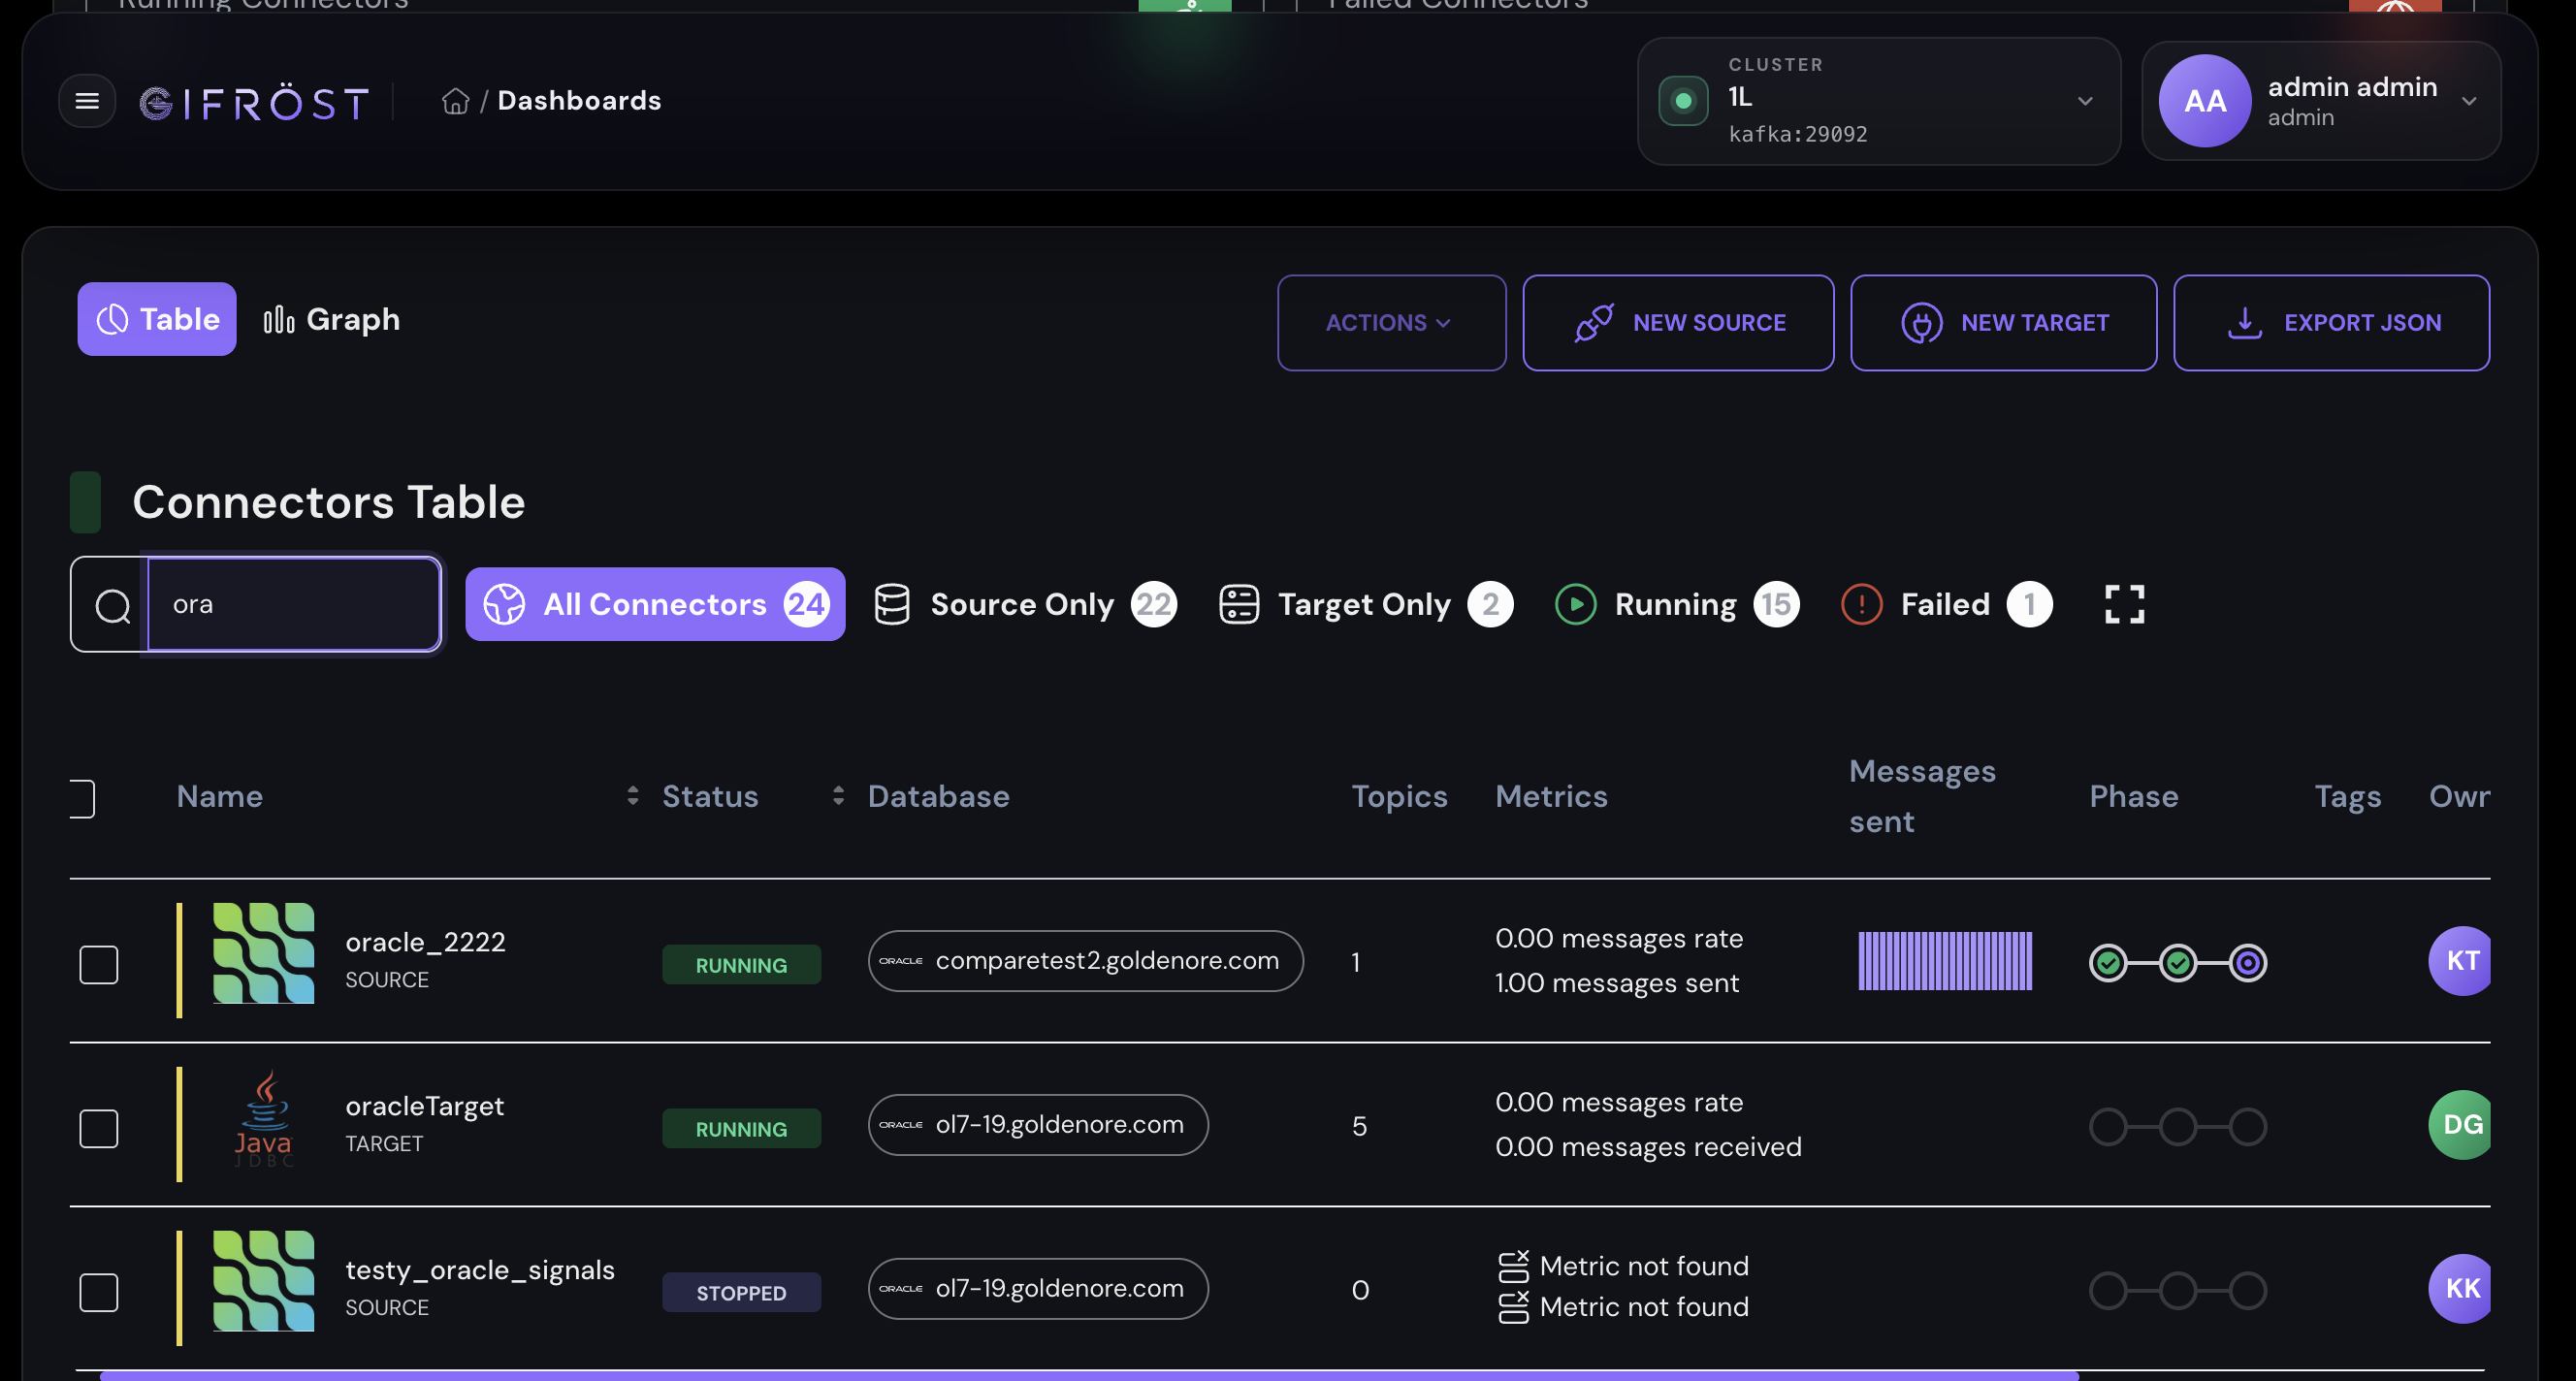
The dashboard presents connector status in table and graph views. Operators can filter connectors by name, type, status, and cluster, open connector details, run actions, and export configuration as JSON.
The table view is optimized for daily operations. It shows connector type, status, database, topic count, flow metrics, sent or received message counts, processing phase, and configuration owner.
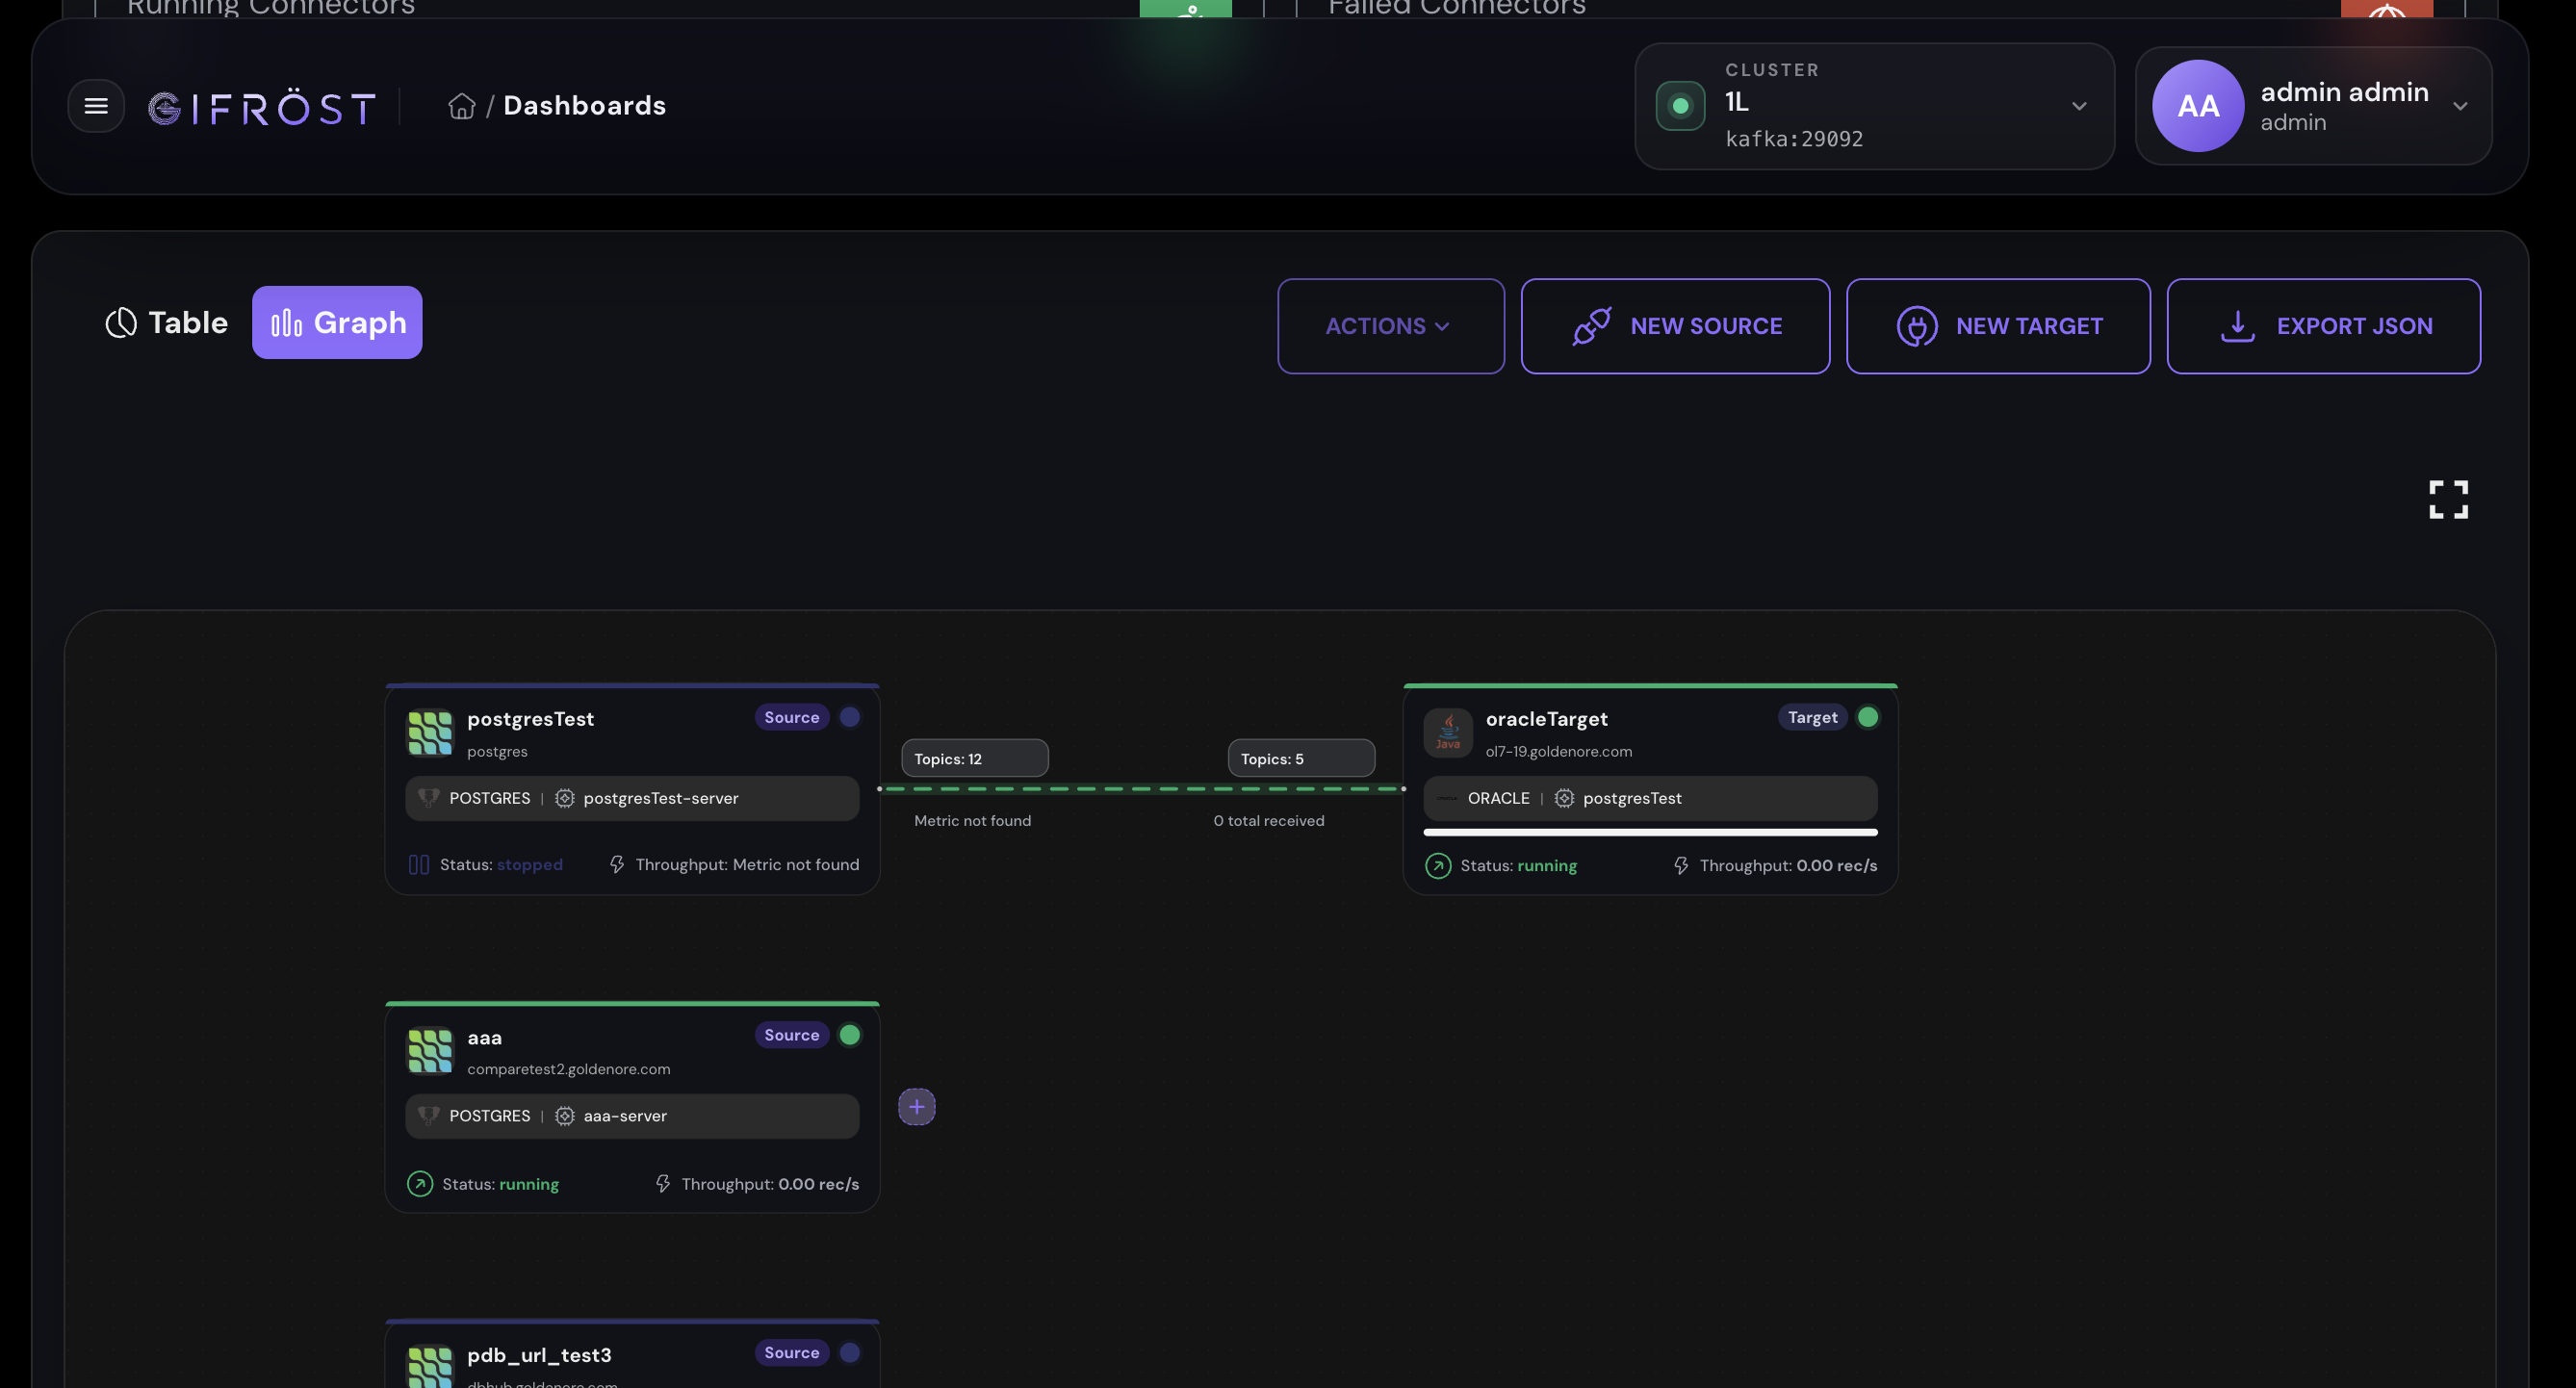
The graph view helps analyze relationships between sources, Kafka topics, and targets. It provides a clear view of the elements that build a replication flow and where processing currently takes place.
Replication Configuration
The GUI guides the user through the complete replication setup:
- selecting a source connector,
- selecting or creating a source database connection,
- configuring connector parameters,
- selecting the loading mode, including initial load and continuous change streaming,
- selecting Kafka topics used as the central data-flow layer,
- selecting a target connector,
- configuring the replication target,
- saving the configuration and running it on the selected Kafka Connect cluster.
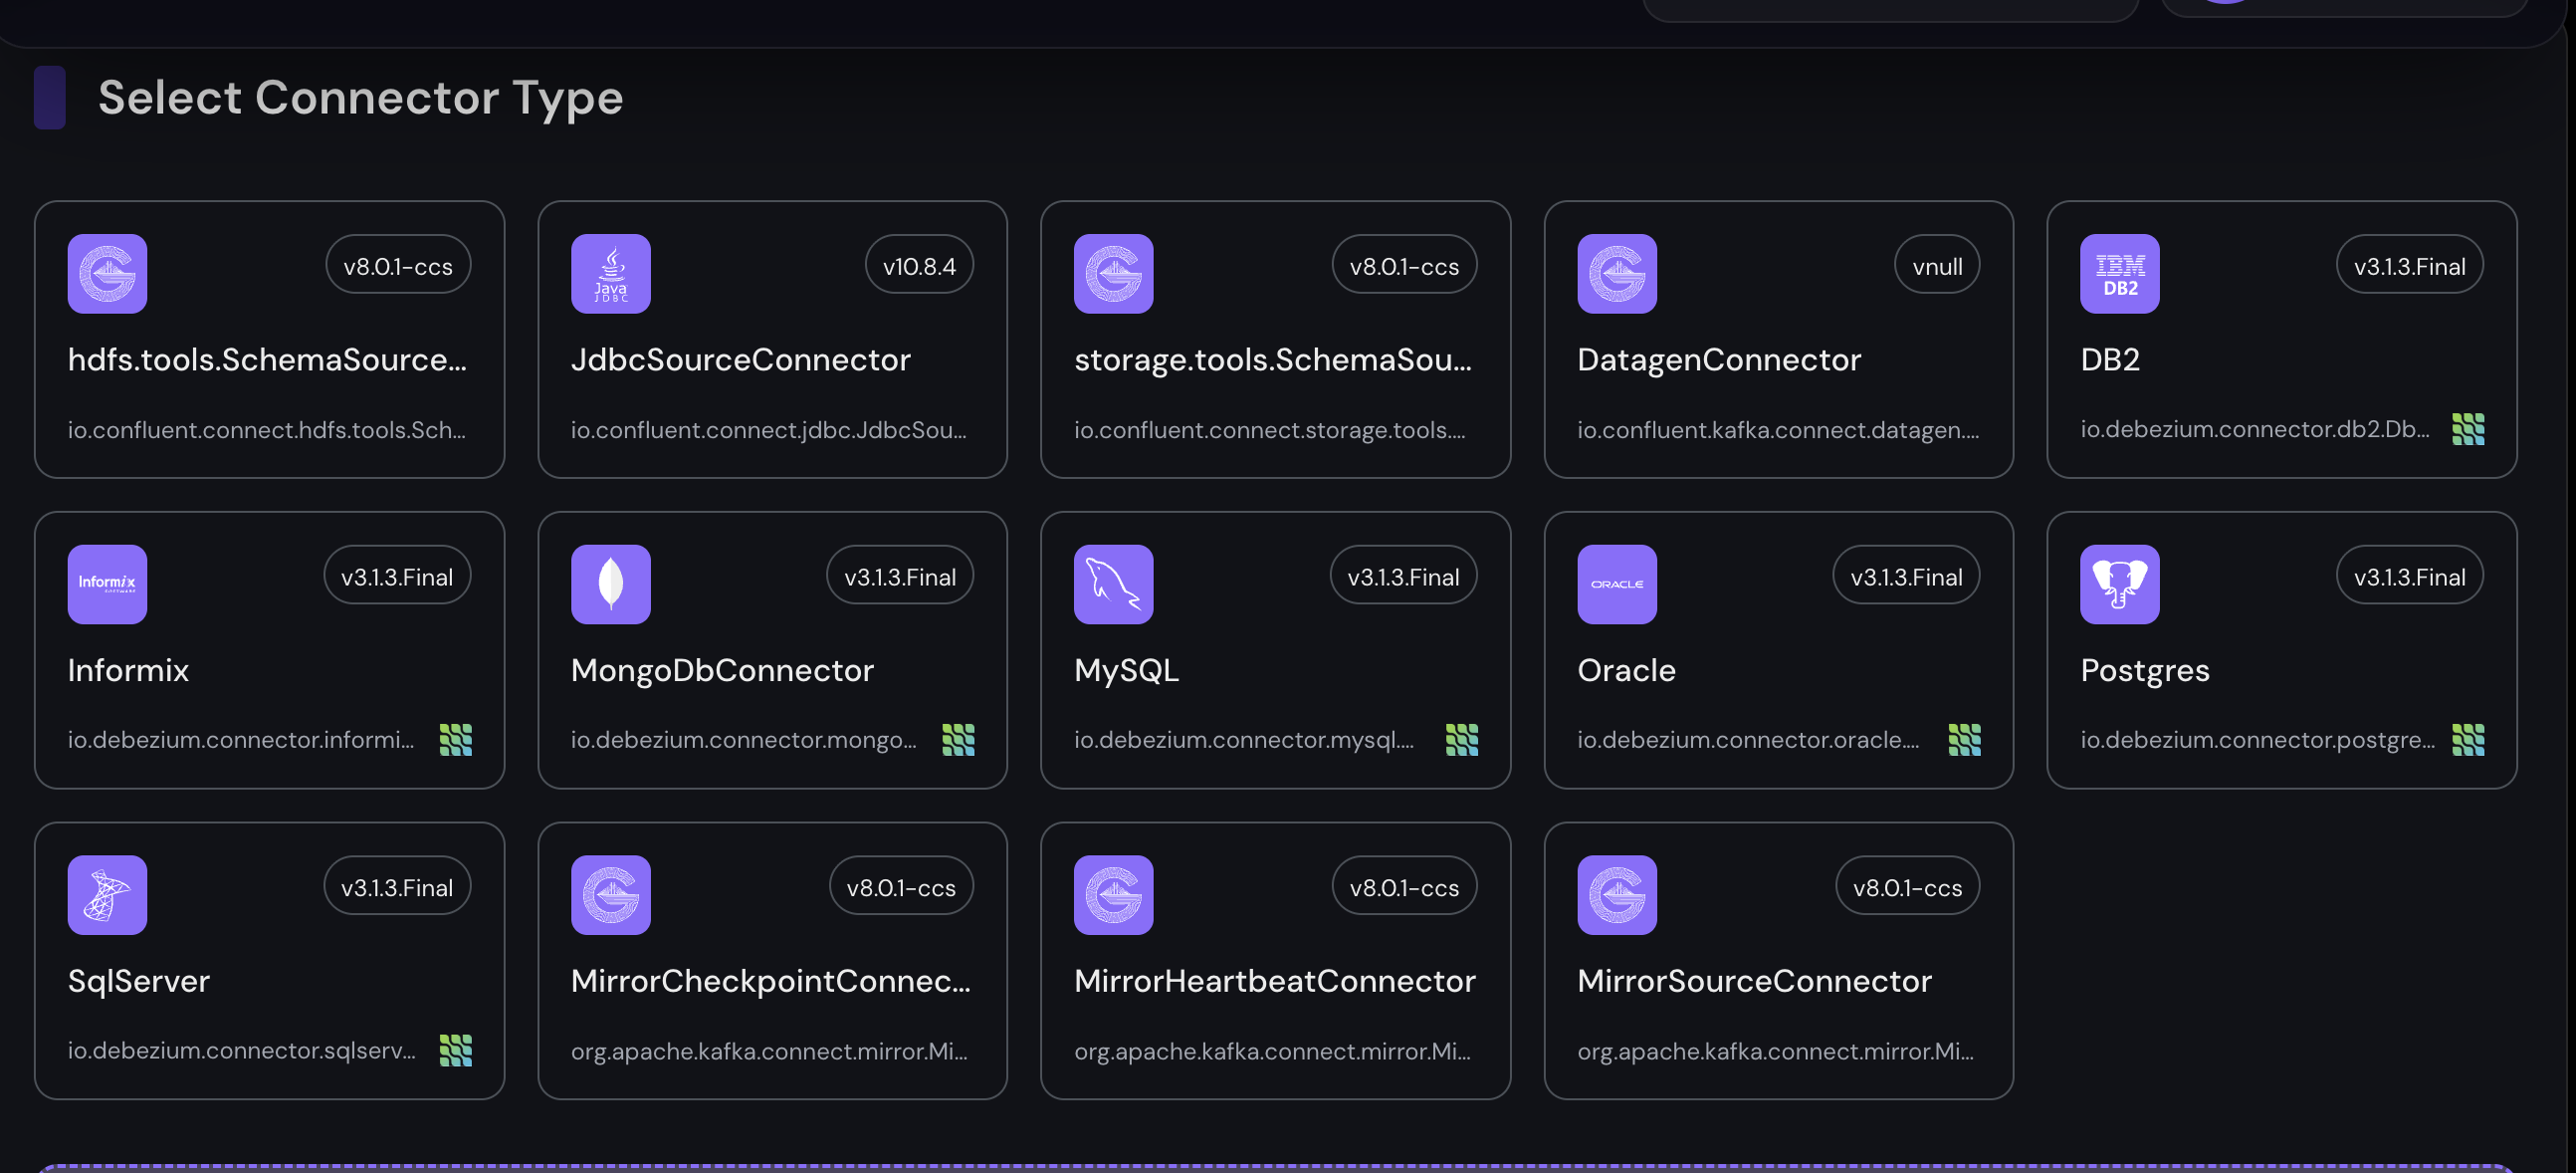
The source selection screen starts the configuration from the source database technology. Available connectors include Debezium connectors for PostgreSQL, Oracle, MySQL, SQL Server, Db2, MongoDB, and Informix.
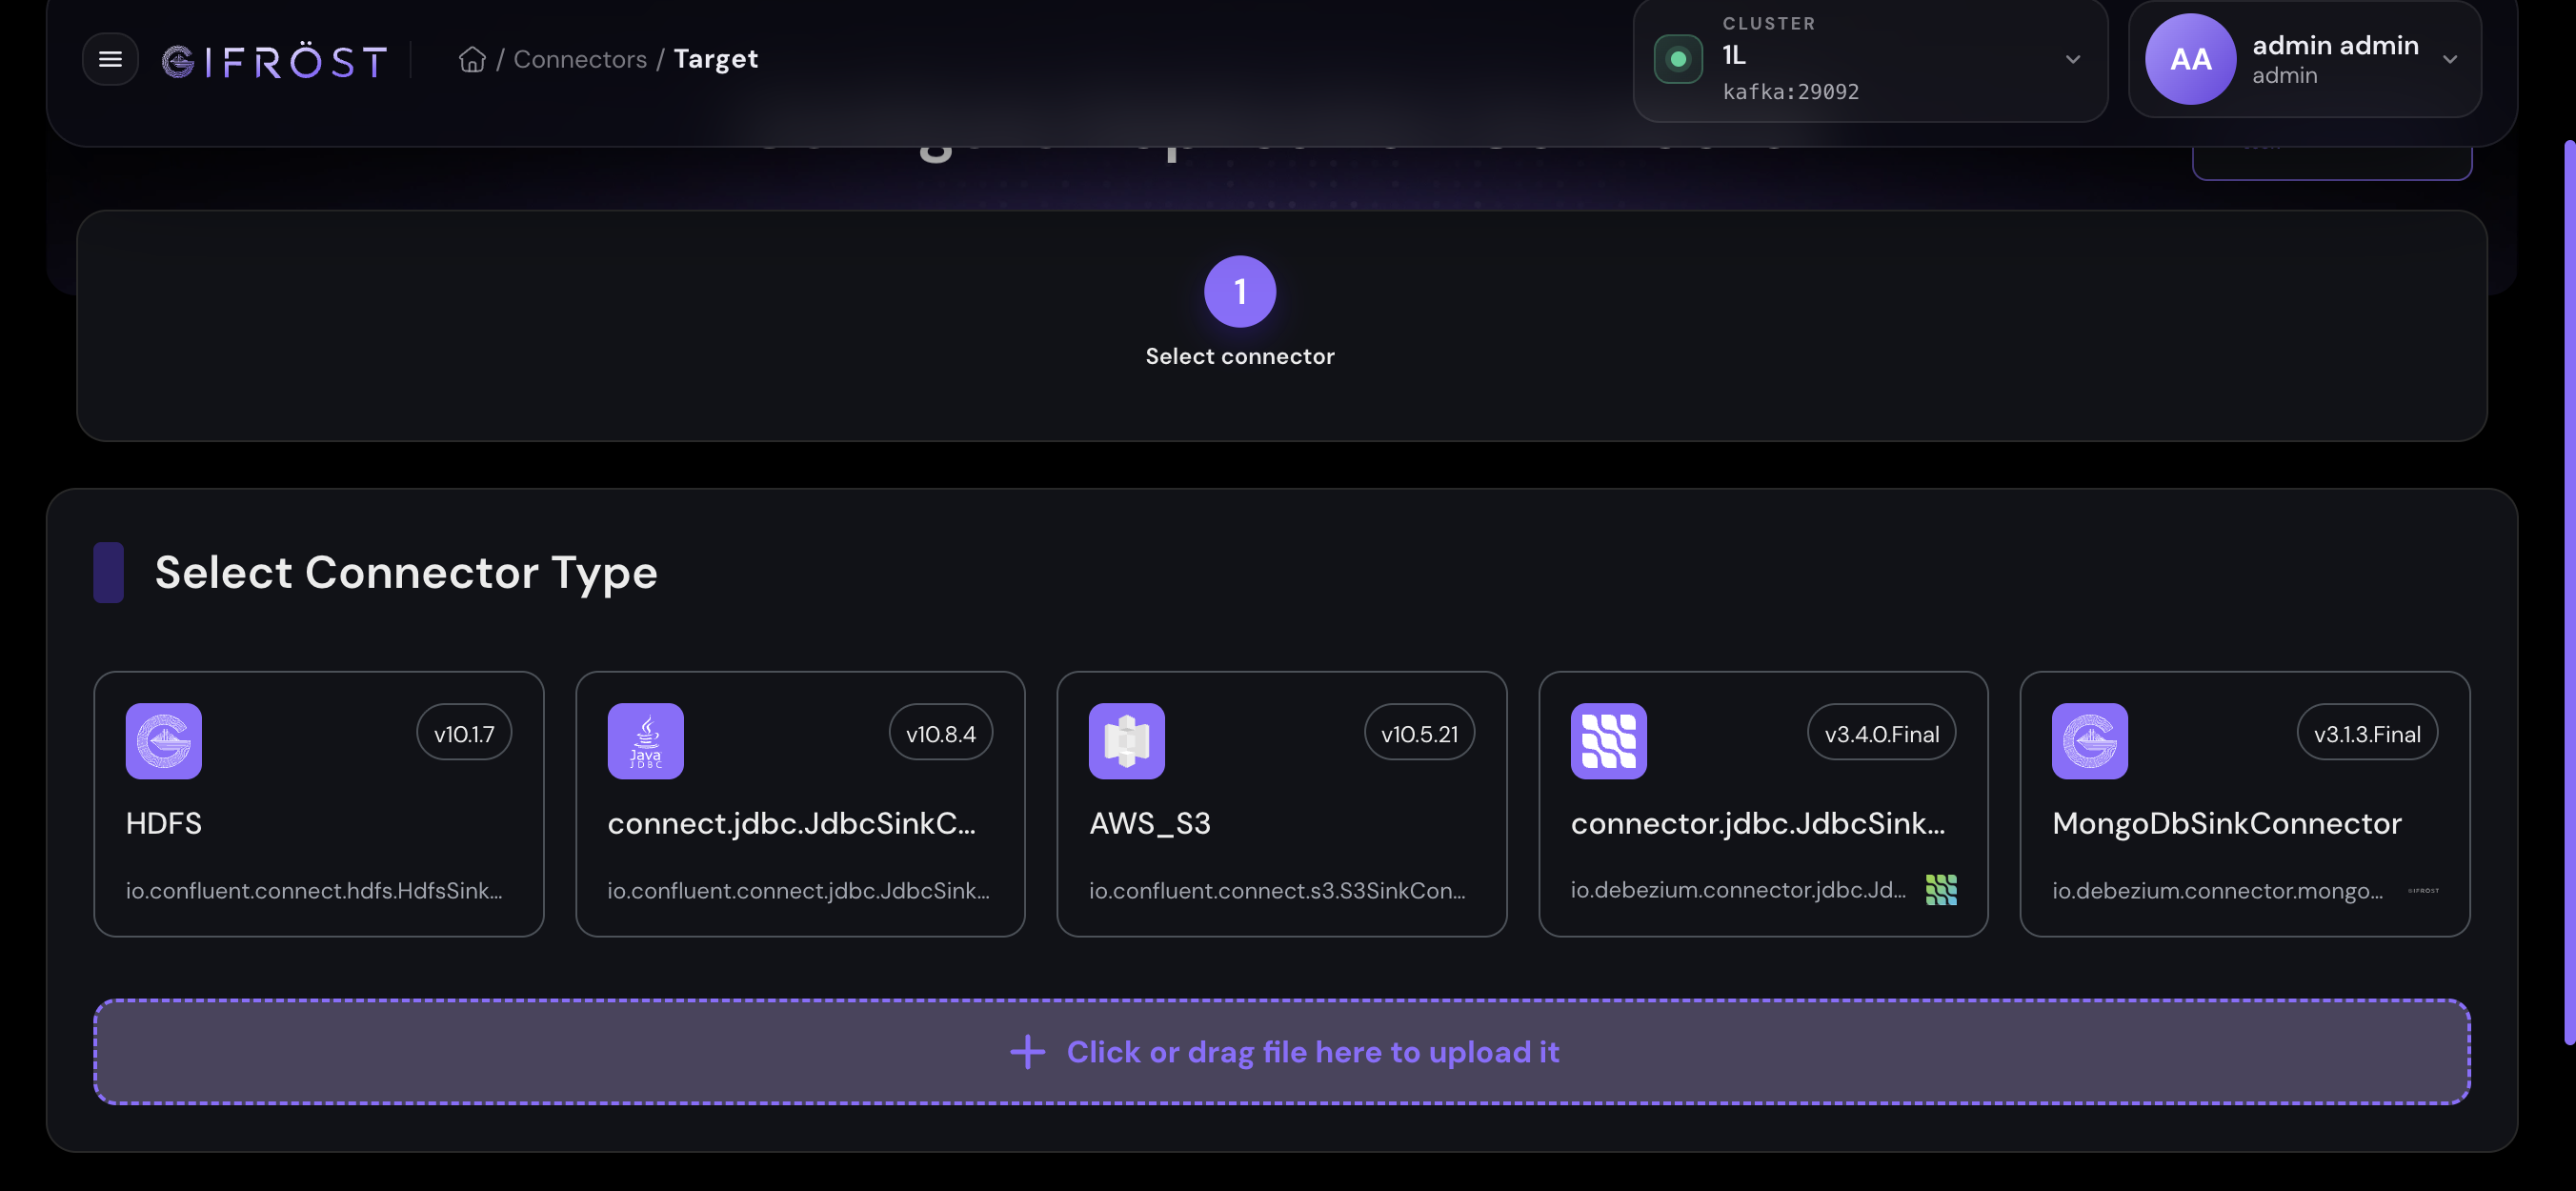
The target selection screen defines where replicated data is written. Supported targets include JDBC destinations, MongoDB Sink, and storage systems such as HDFS and AWS S3.
Config Store And Credential Security
Connector and connection configurations can be stored in a central configuration repository acting as a Config Store. Once prepared, connection definitions, connector parameters, and replication settings can be reused across future configurations.
The Config Store supports:
- saving source, target, and connector configurations in the database,
- reusing configuration across modules,
- retaining configuration and operational history,
- reducing manual parameter entry,
- using the same connections consistently across replication, monitoring, comparison, and configuration wizards.
Credentials are handled as a protected part of the configuration. This limits password exposure and allows saved connections to be reused between modules without manually passing credentials each time. This mechanism is related to Database Store, which stores and exposes database connection definitions.
Table Monitoring And On-Demand Loading
The connector detail view allows operators to inspect replicated topics and tables. It exposes record counts, event types, topic existence status, and table-level actions.
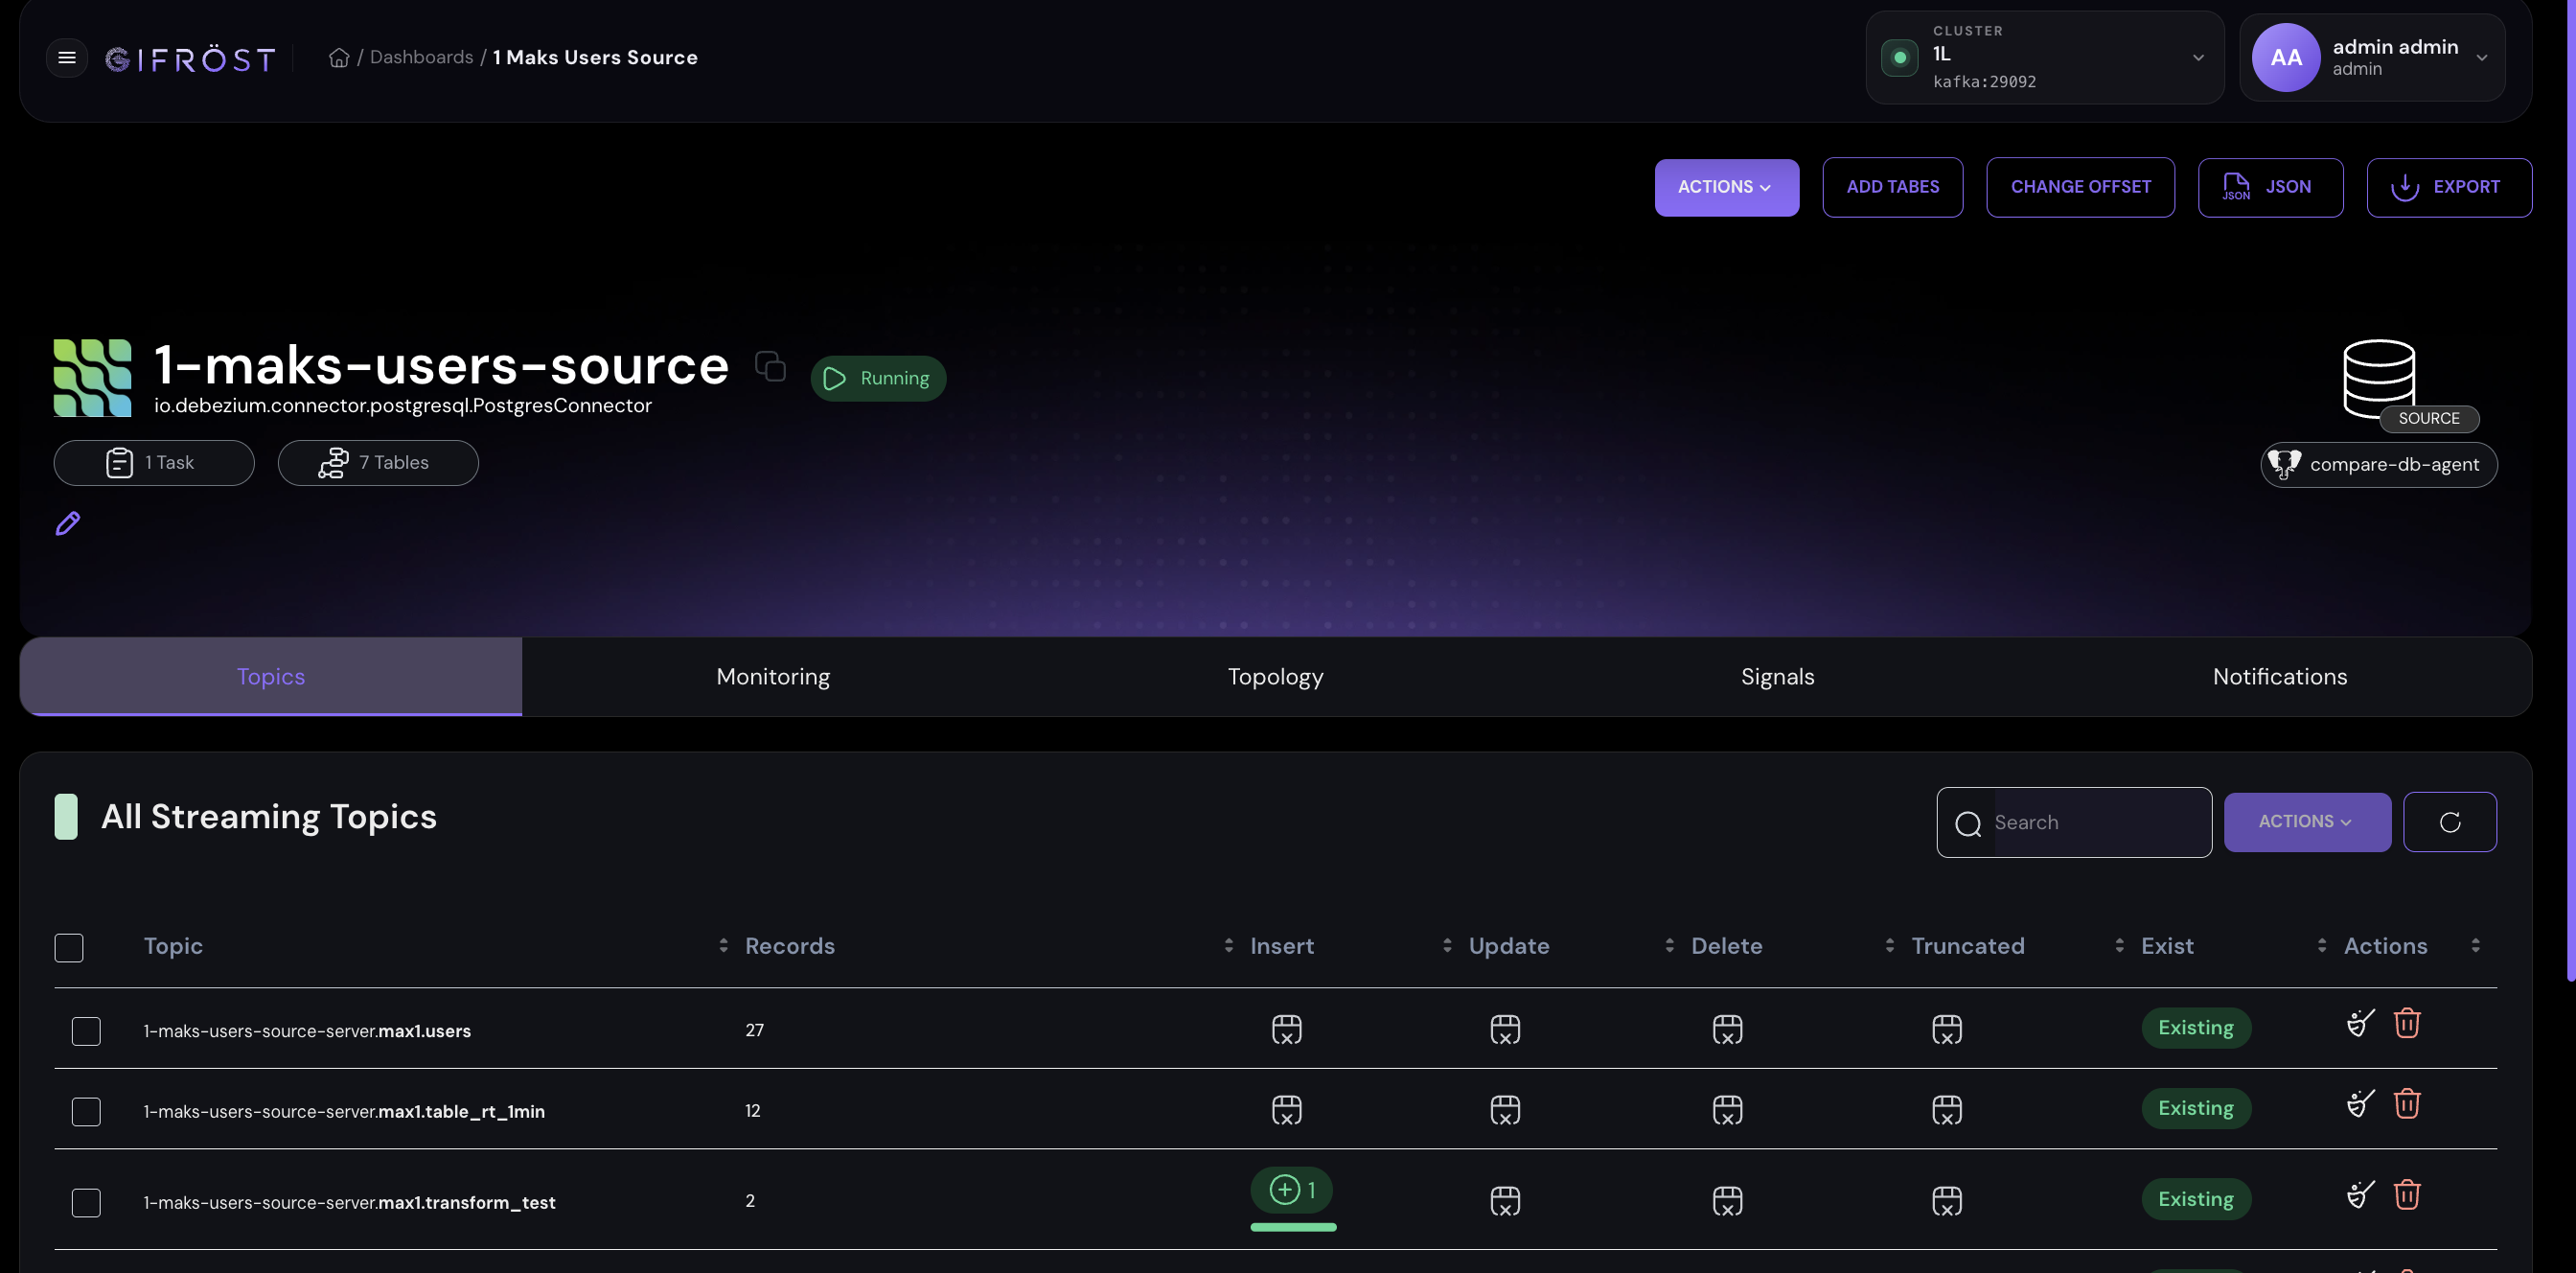
For selected tables, the operator can trigger an on-demand initial reload. This is useful when a table needs to be loaded again, recalculated from its initial state, or synchronized after a configuration change.
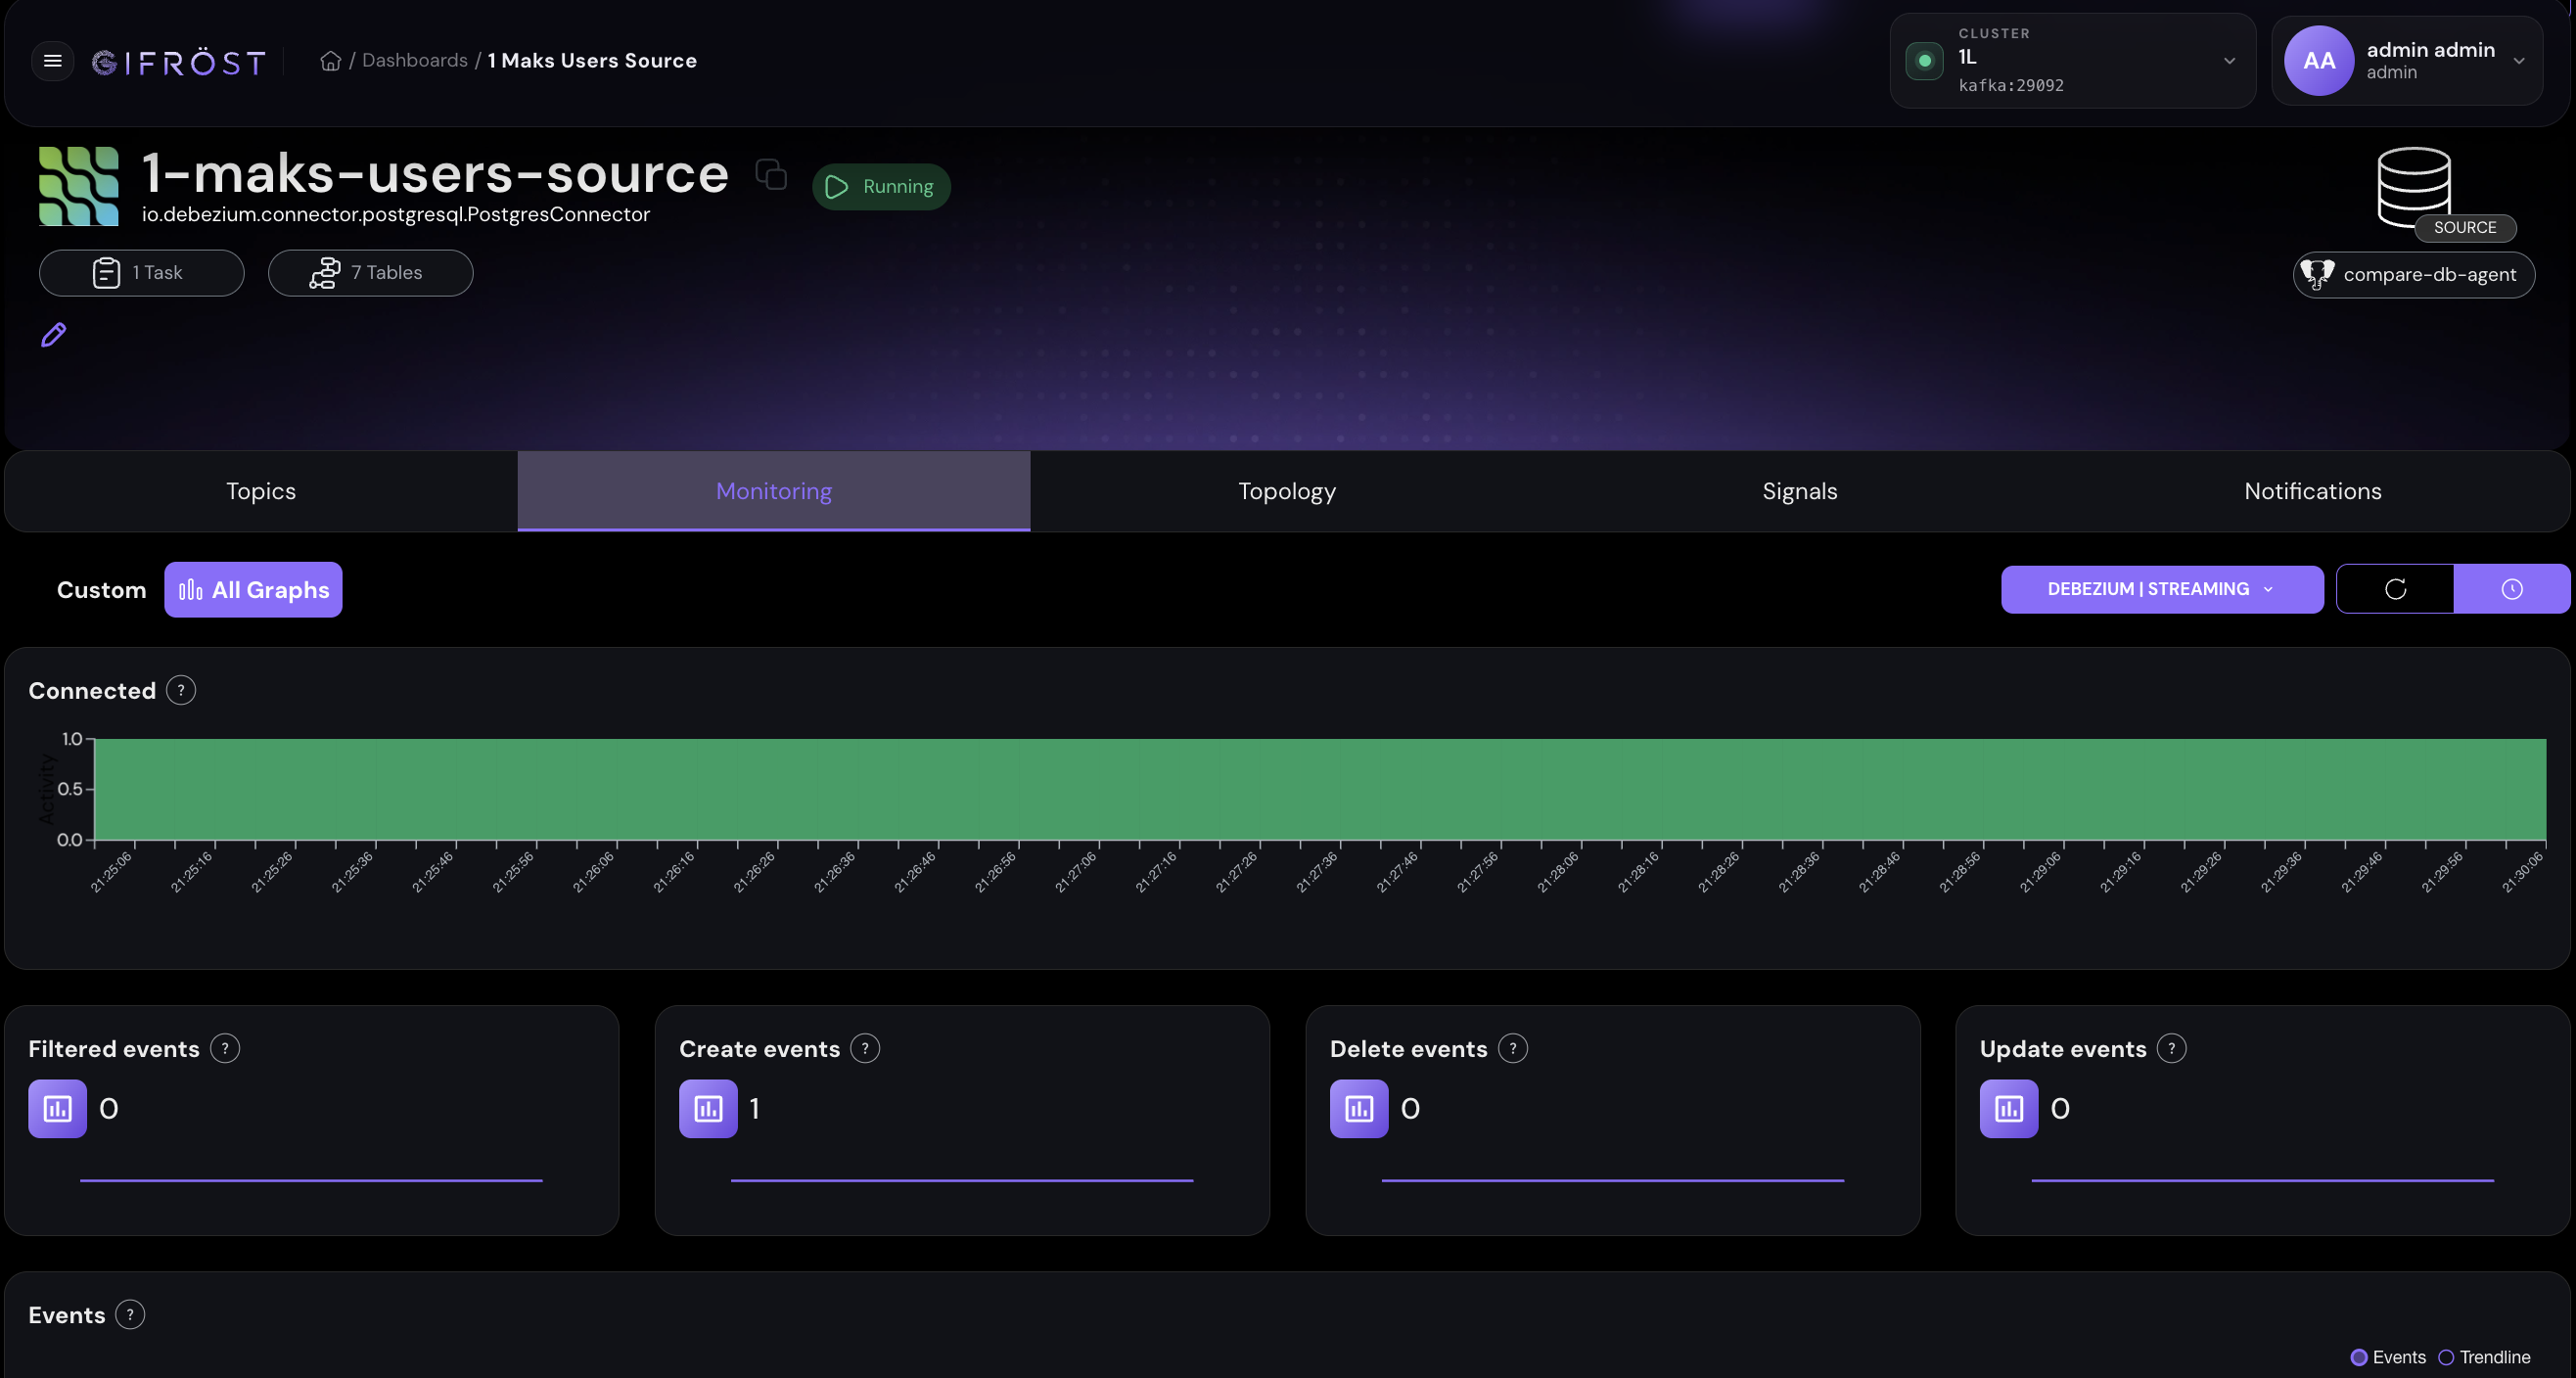
The monitoring tab presents connector metrics, including activity, create events, update events, delete events, and filtered events. This helps assess flow quality and quickly detect replication interruptions.
Topology And Flow Analysis
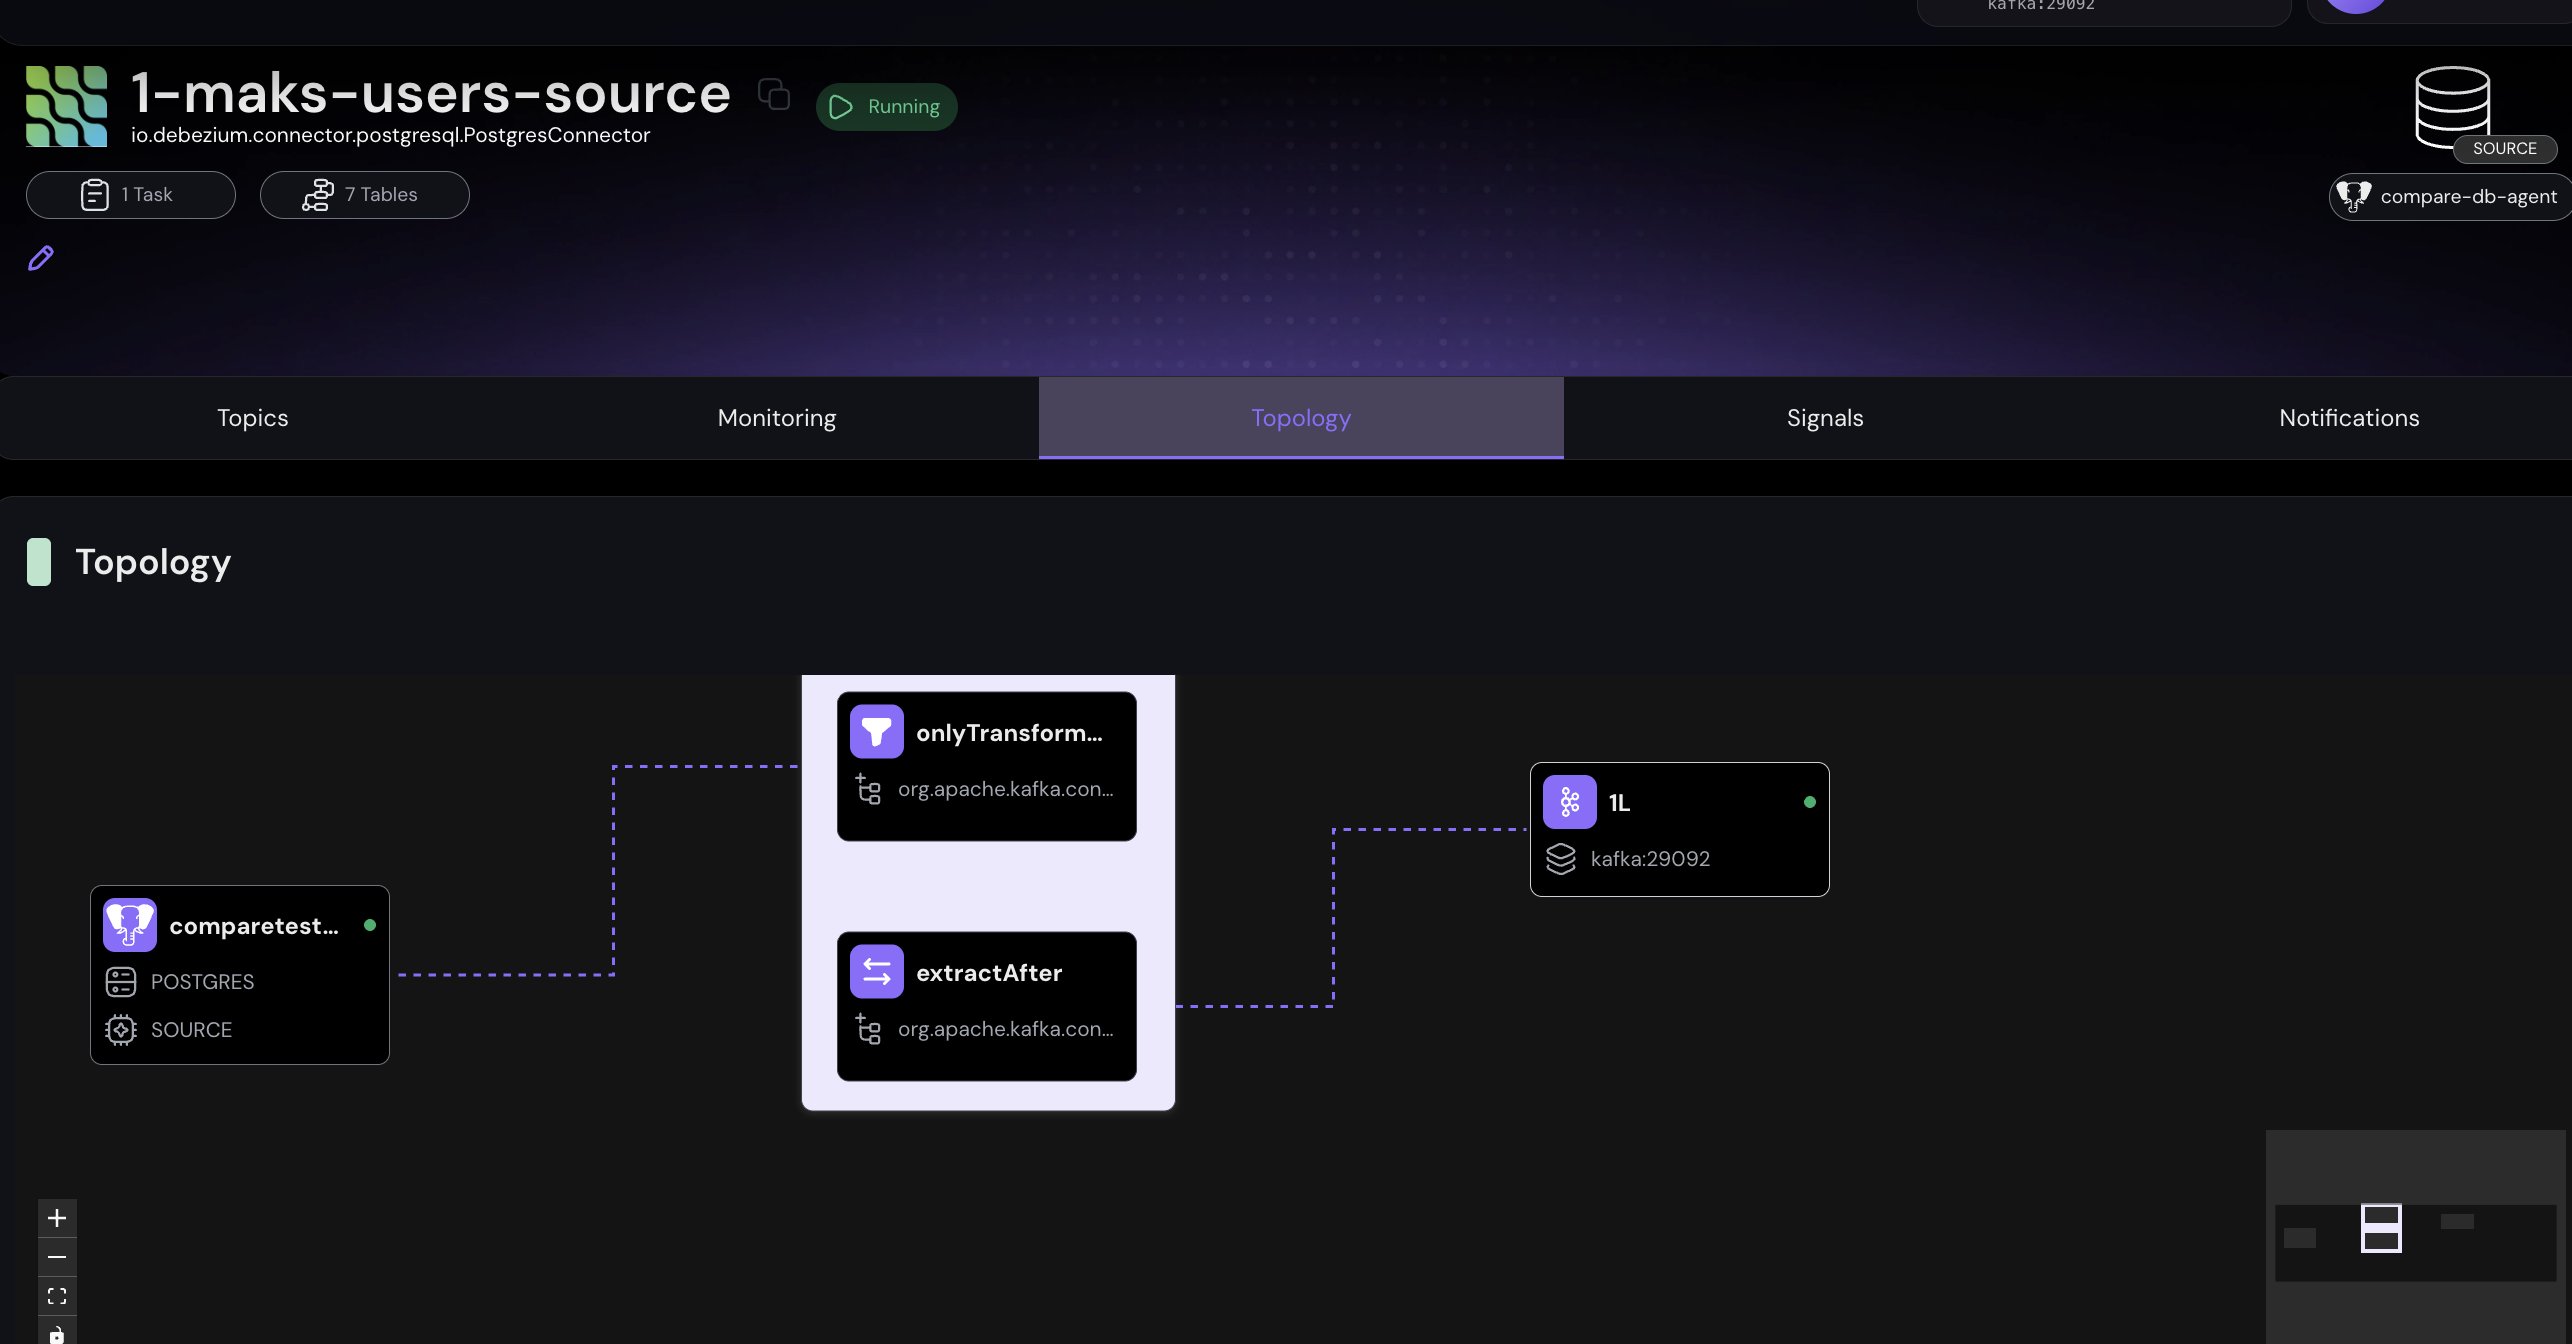
The GUI shows connector topology and processing steps. Operators can verify the source of a stream, transformations applied to the data, and the cluster or component that receives it.
Kafka and its topics are the central layer of the data-flow architecture. This layer is used for monitoring, diagnostics, table reloads, and data reconciliation. The Compare module uses this context to verify consistency between source and target data.
Automation, Tasks, And Actions
The interface also supports operational tasks related to monitors, tasks, and actions. This enables automated reactions to events such as connector stops, missing metrics, flow latency, processing errors, or required administrative operations.
Automation mechanisms are described in Monitoring & Alerting and Actions. As a result, the GUI is not only a configuration panel, but also an operational control surface: it supports environment observation, on-demand actions, and linking events with system responses.
Working Ergonomics
The GUI is designed as a clear and ergonomic interface for teams maintaining data replication. The most important operations are available from one place: source and target configuration, topology inspection, monitoring, configuration export, parameter management, connection reuse, and operational event handling.
This approach reduces manual work, lowers configuration risk, and makes replication manageable as one coherent process instead of a set of independent files, scripts, and manually maintained definitions.
The connector catalog is extensible. Additional standard, non-standard, or custom Kafka Connect plugins can be added to the environment and exposed in the interface when required by a project.